Segmentation
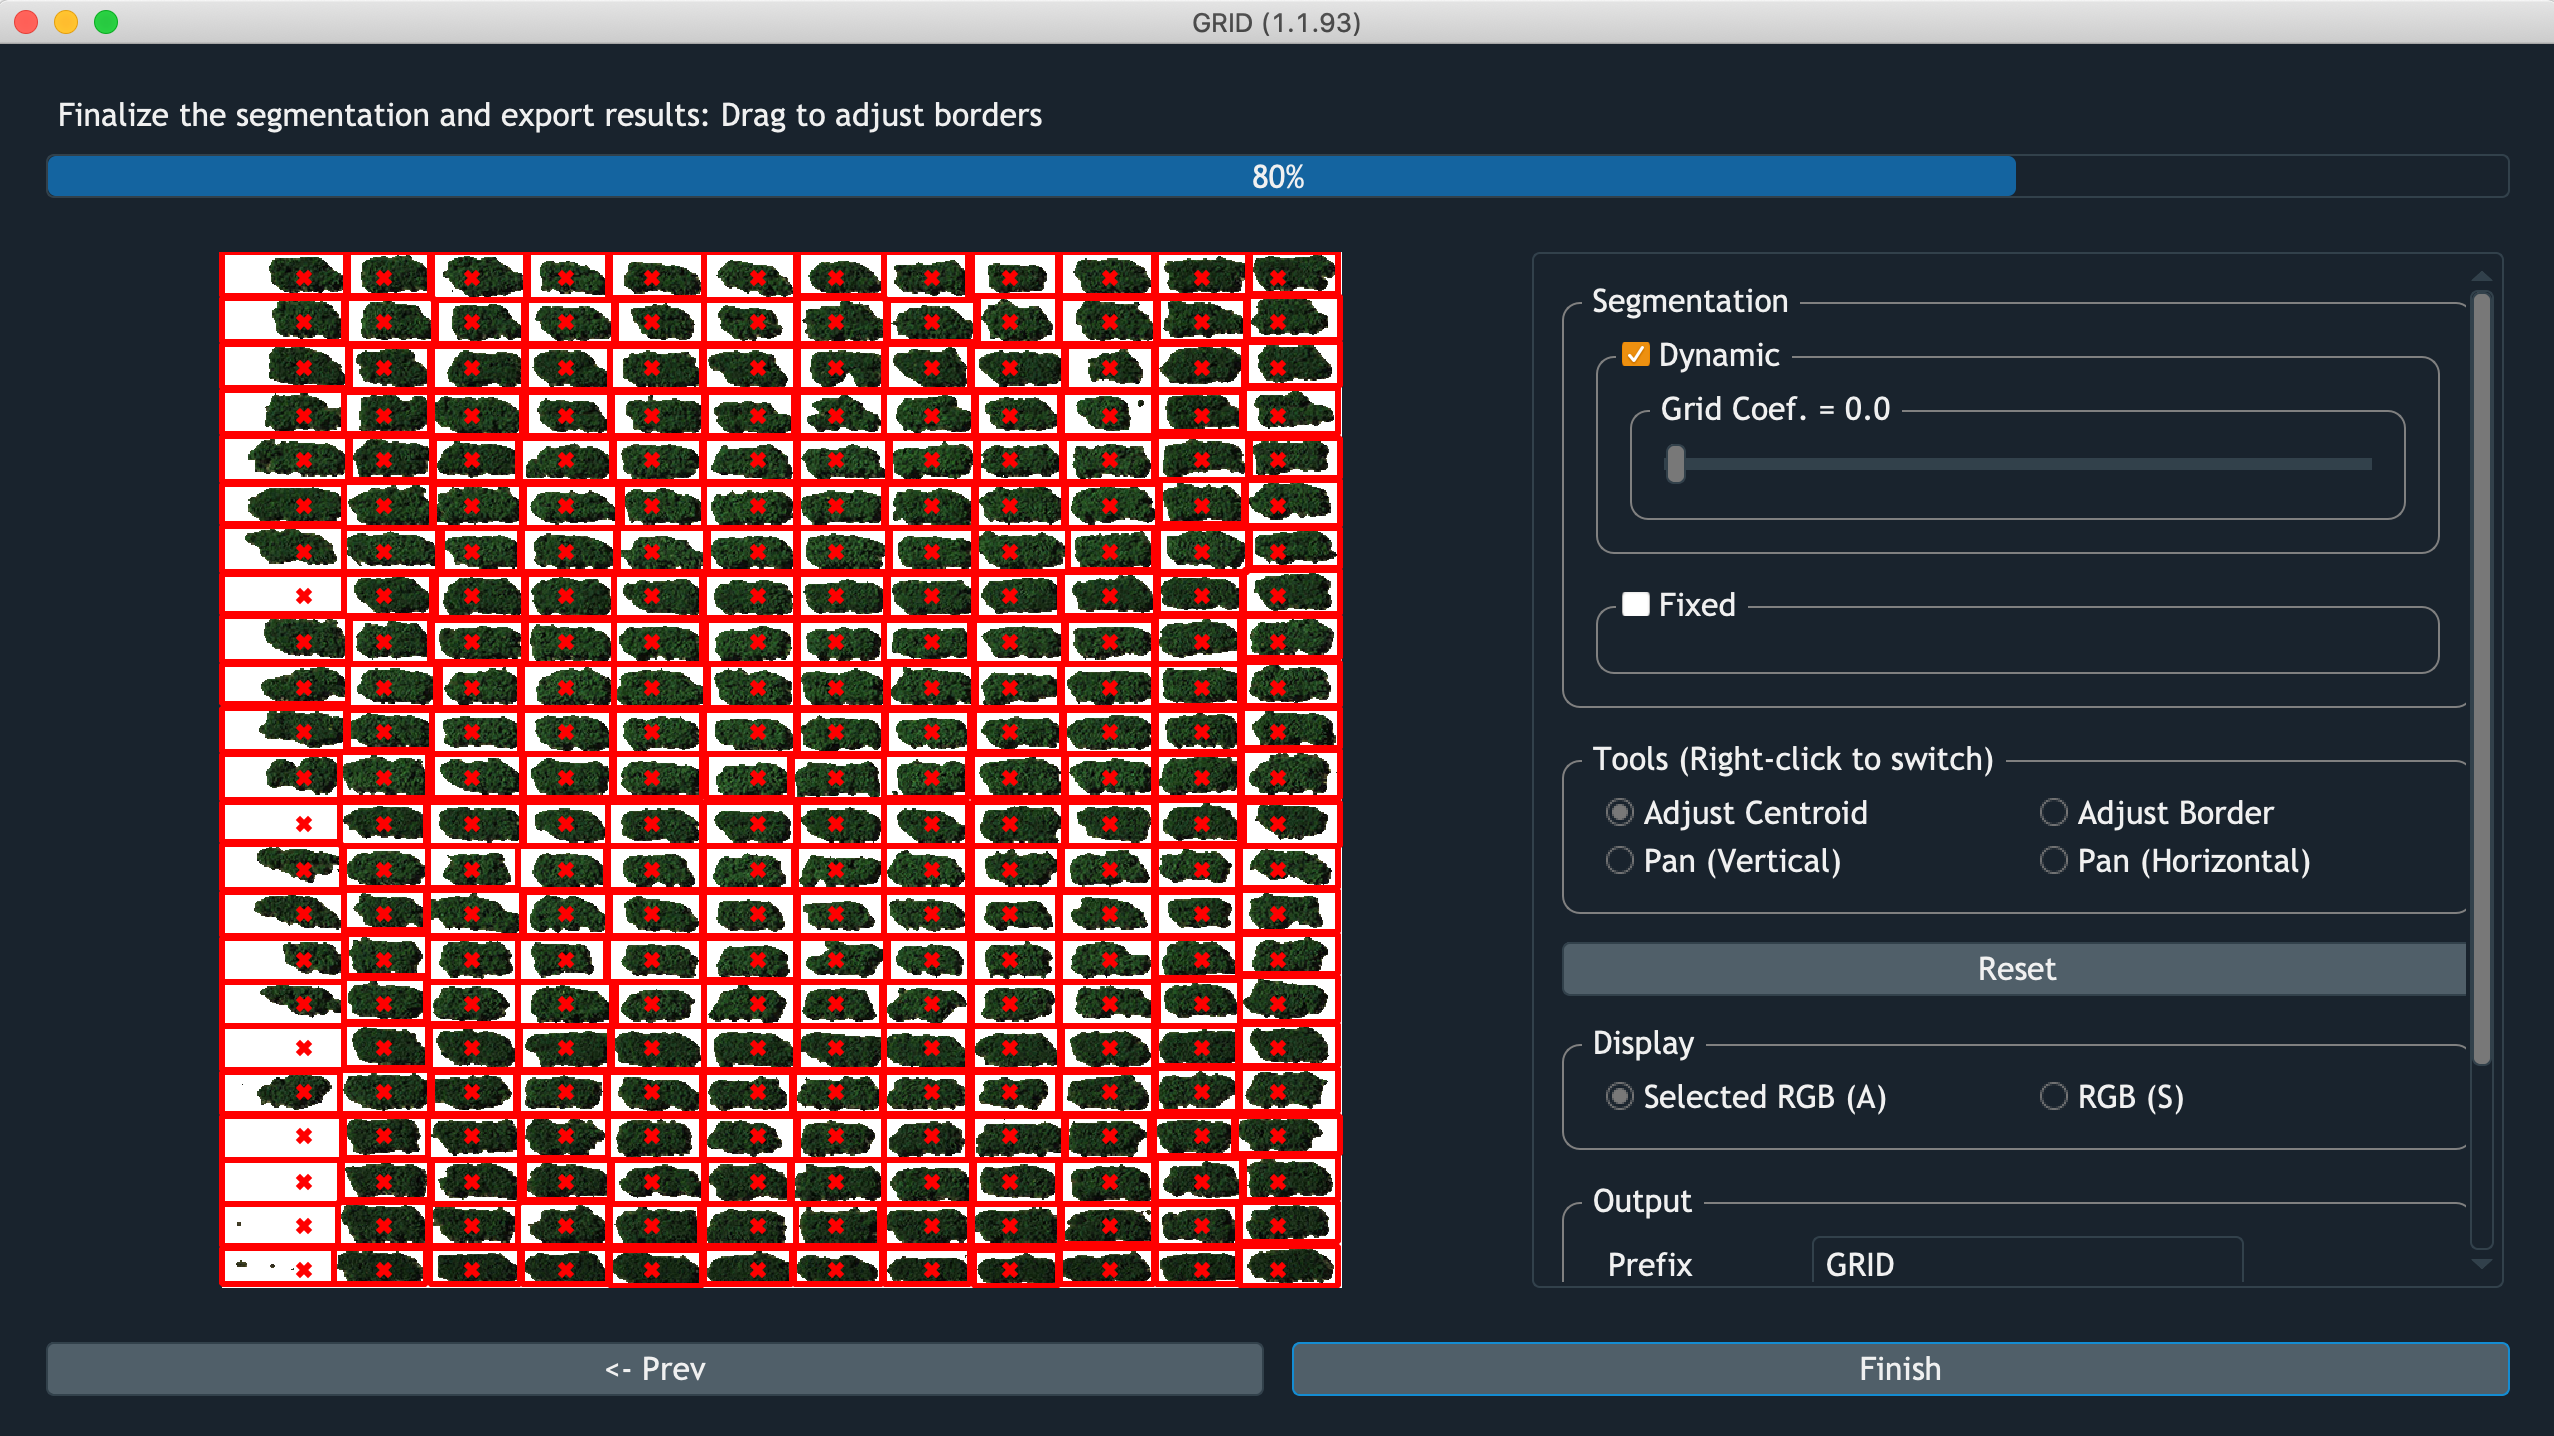
Screenshot of GRID performing segmentation
Dynamic
GRID infers plot boundaries based on the POI distribution.
The only tunable parameter Grid Coef. is how much weight should be put
on the global layout over local pattern.
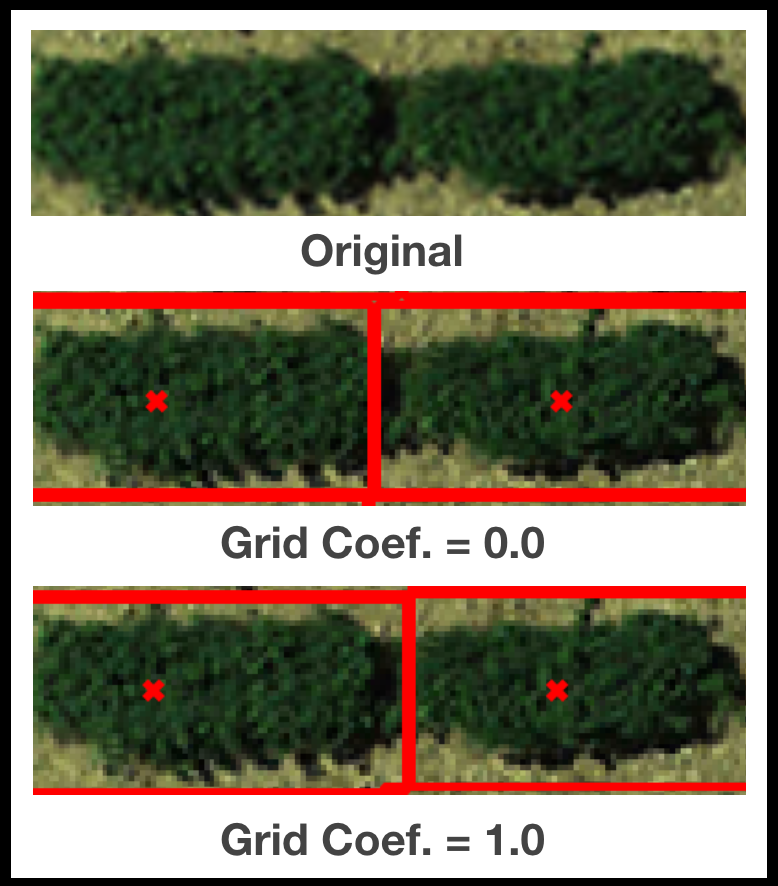
For example, when the boundary between two adjacent plots are ambiguous,
Grid Coef. = 0.0 would encourge plot with more connected POI to
agressively expand its border.
Whereas Grid Coef. = 1.0 would let both of their borders to follow
the pattern from other rows/columes.
Fixed
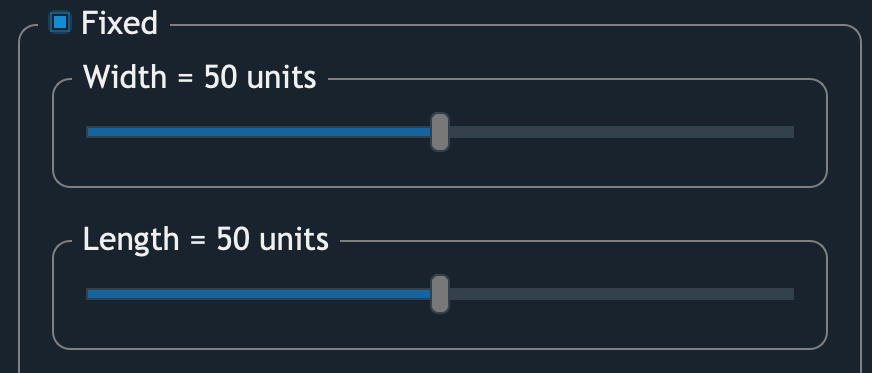
If the option Fixed is checked,
plots will be assigned boundaries with an equal size.
The size of units is obtained from:
For example, if an input image is 1,000 pixels wide,
and there’re 10 columns of plots.
1 unit then become 1 pixel wide.
In this case, assigning 50 units width to the plots meaning
each plot would has 5 pixel wide boundary.
And when width = 100 units,
plot boundaries should horizontally occupy the entire image.
Fine-tune results
GRID provides several ways to fine-tune the segmentation results:
- Move centroids
Left-click and drag within the plots to move the centroids
- Resize borders
Left-click and drag at the inner side of the border to resize it.
- Row positions
Left-click and drag at any row of plots to move the entire row.
- Column positions
Left-click and drag at any column of plots to move the entire column.
Export results
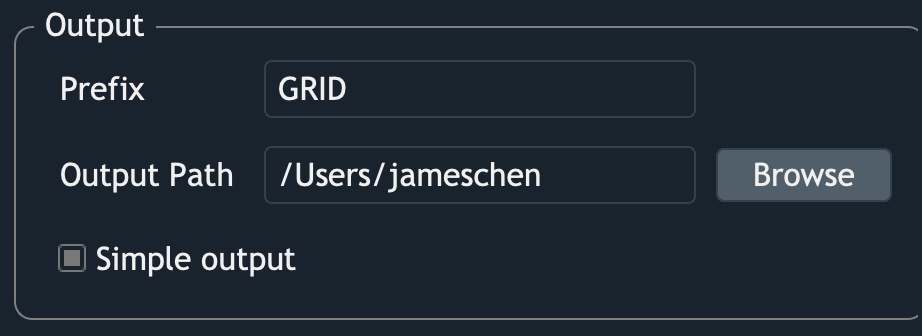
- Prefix
GRID will create a folder for placing the outputs. The name of this folder is the specified
Prefix, and all the output filenames will start wtth thePrefix.
- Output path
A path where you want the outputs to be saved
- Simple output
By checking this option, only basic results will be saved. There’s further discussion in this section <Outputs>