GRID: Deal with Field Segmentations Elegantly


Getting started
First-time users: Launch GRID | Demo mode | Work with your images |
Interface
File loading: Input files | Drag and drop |
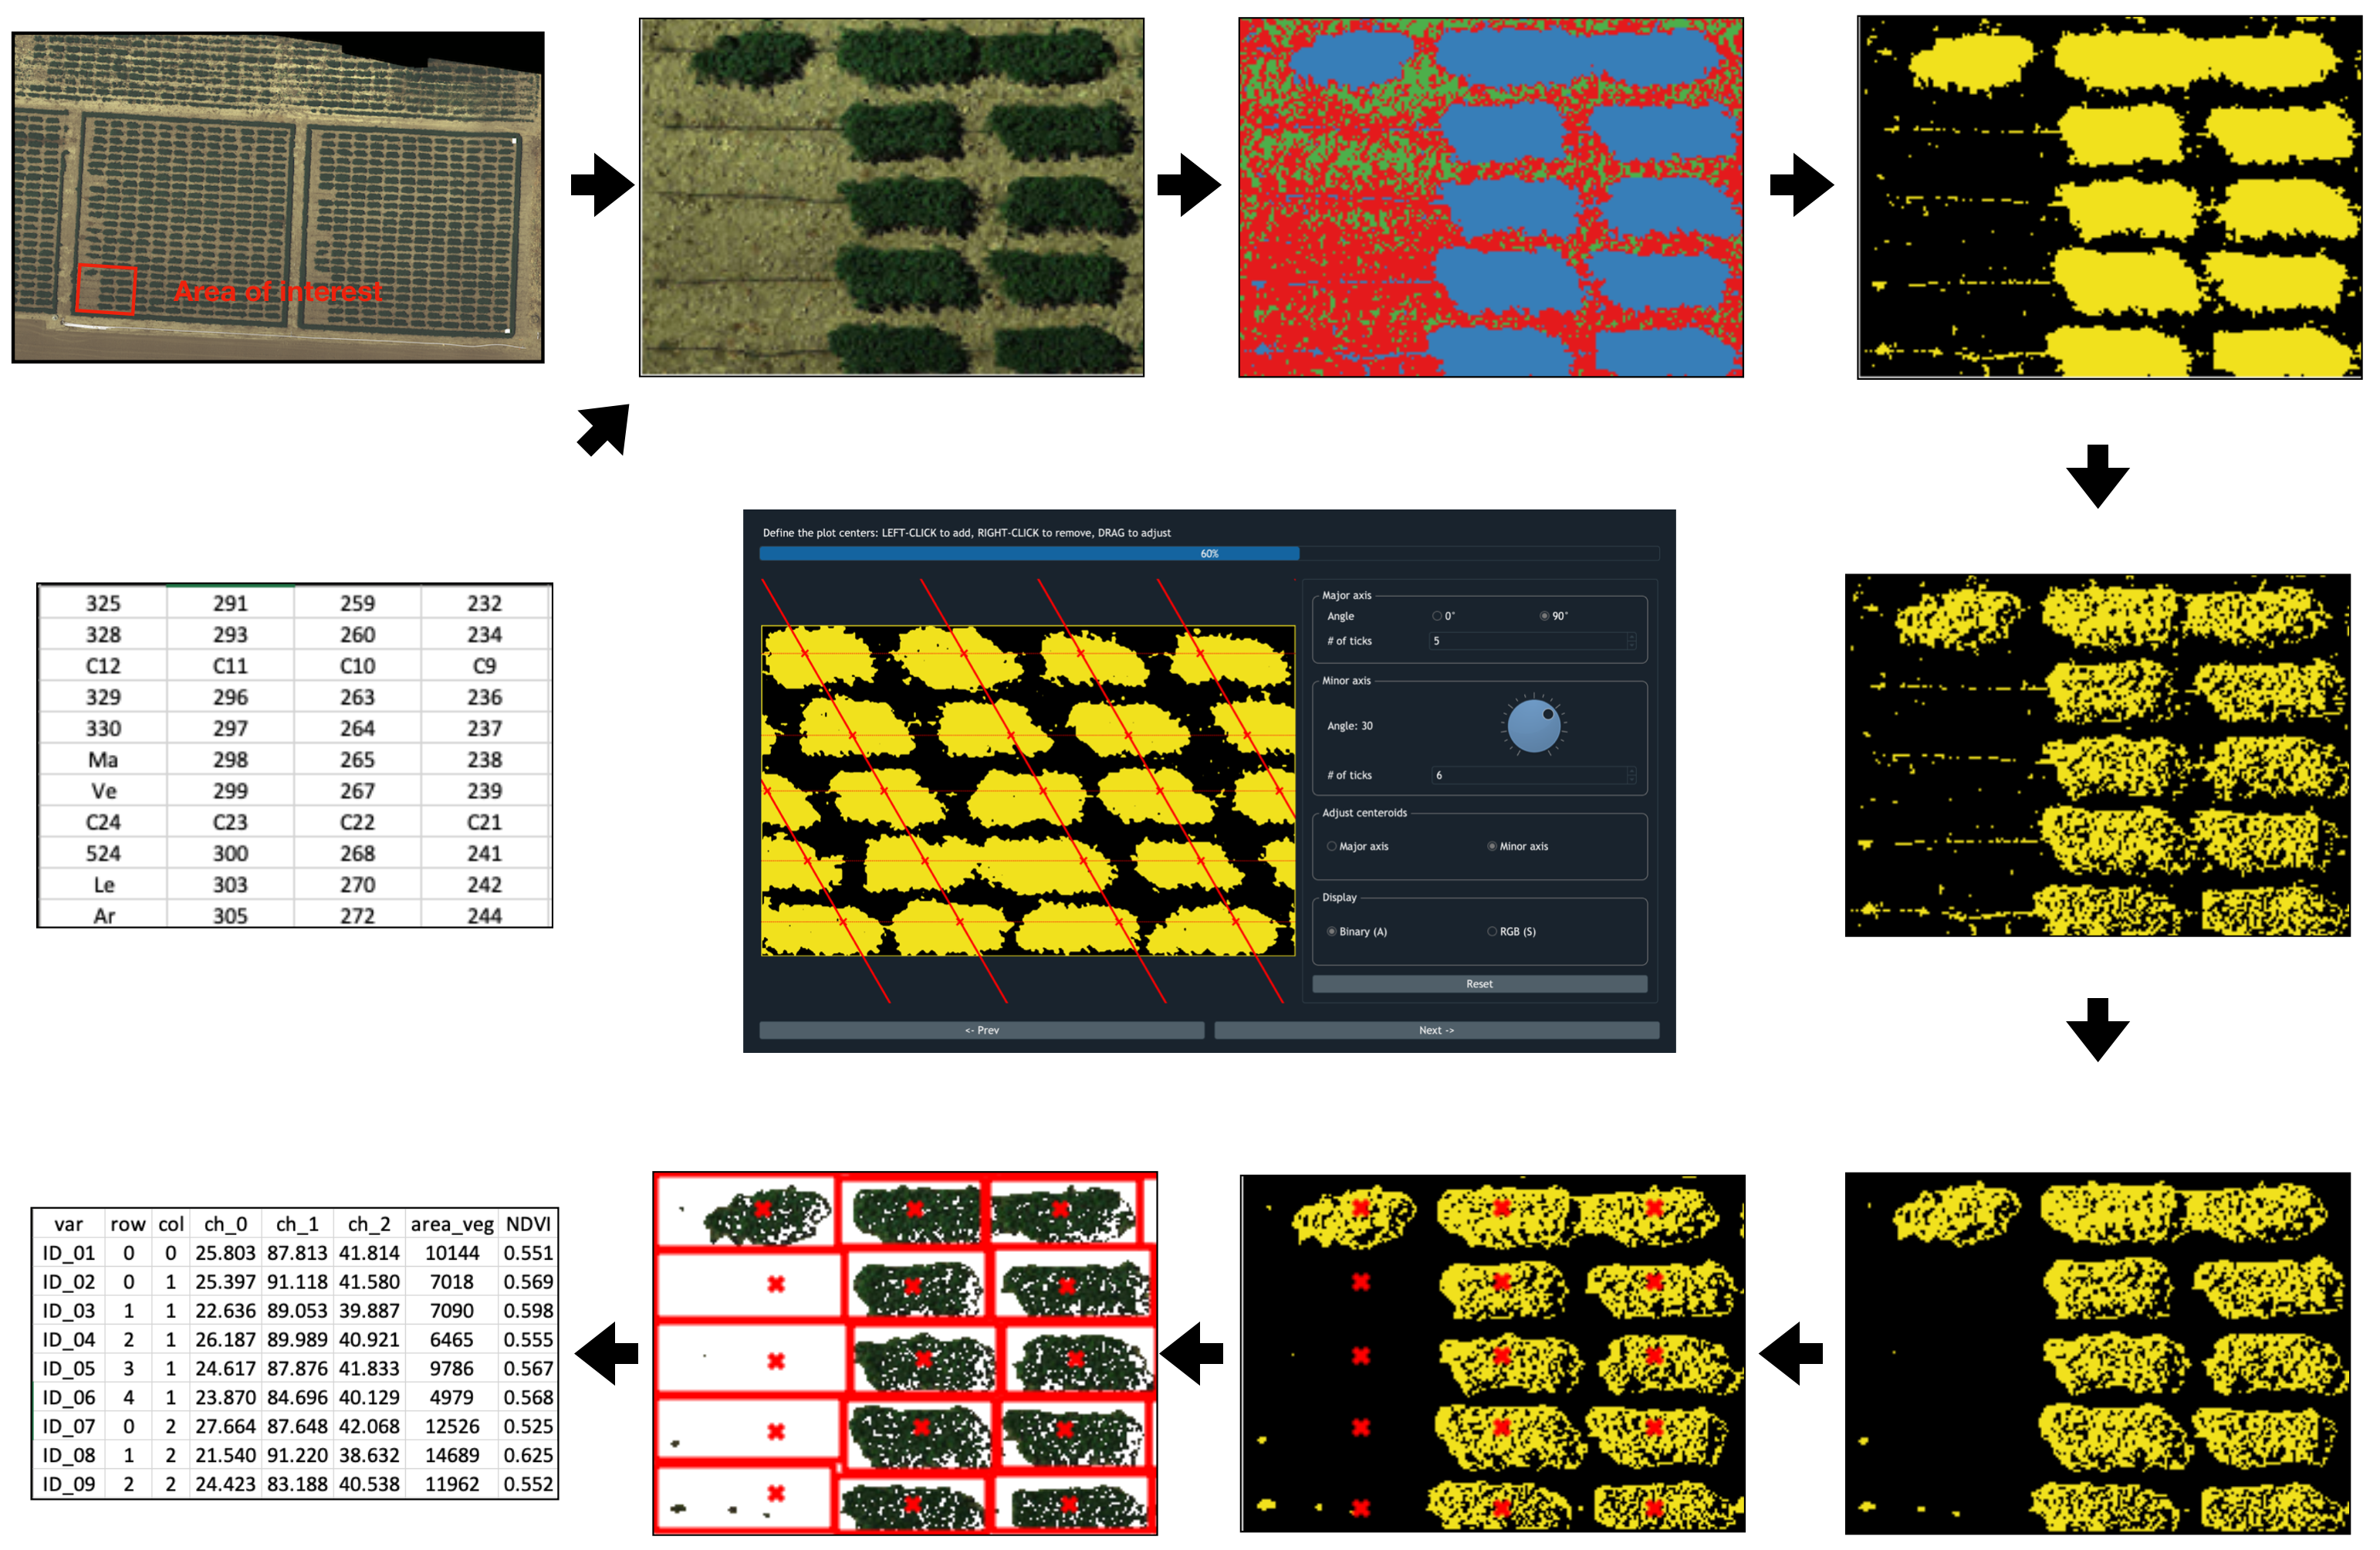
Define AOI: Draw AOI | Adjust AOI |
Define POI: K-Means clustering algorithm | Binarization | Refine POI | Display/Zoom |
Detect centroids: Major axis | Minor axis | Centroid adjustment |
Segmentation: Dynamic | Fixed | Fine-tune results | Export results |
Inputs/Outputs
Inputs: Images | Maps | Shapefiles |
Outputs: Tabular results | Validation | Shapefiles | NumPy format of AOI | H5 dataset |
Advanced usage (Jupyter notebook)
How to cite GRID
To cite GRID, you can:
Import GRID.bib
or manually key in the following info:
@article{Chen and Zhang:2020,
 author       = {Chunpeng James Chen and Zhiwu Zhang},
 title        = {GRID: A Python Package for Field Plot Phenotyping Using Aerial Images},
 month        = may,
 year         = 2020,
 journal      = {Remote Sensing},
 volume       = 12,
 issue        = 11,
 pages        = 1697
 doi          = {10.3390/rs12111697},
 url          = {https://doi.org/10.3390/rs12111697}
}
Support
Find any issue? Post it on GitHub or contact James Chen